golang, delve, debug
delve で Go のプログラムをデバッグする
Go はかれこれ 4年ほど書いているが、これまで debugger を使わなくても、スタックトレースと log.Printf("%+v") でこれまで過ごしてきた。
Go は静的型付け言語であり、また言語仕様もシンプル(ジェネリクスが現状なかったり)のため、コンパイルして問題箇所に気づくことも多い。
個人の開発は delve を使わずとも、コンパイルエラーや実行したエラーログで済んでいたが、今後、チームでの開発を進めることになるため、便利なツールはおさえておきたく delve を使ってみた。
delve とは
GitHub - go-delve/delve: Delve is a debugger for the Go programming language. によると、simple で多機能な Go の debug ツールを目指したプロジェクトとある。
インストールは簡単で、go get で取得できるが、自分は VSCode をよく利用するため、VSCode の Go プラグインでインストールする。
VSCode での利用方法については、Visual Studio CodeでGo言語のデバッグ環境を整える - Qiita という記事があるため、ここでは述べない。
実際にデバッグをしてみる
さっそく、個人開発している go-zen-chu/hachi にてデバッグをしてみる。delve が活きるのは、コンパイルは成功したが、実行してみるとエラーになるランタイムエラーで解析する場合などだ。
そこで、実際に開発中に遭遇したランタイムエラーをデバッグしてみる。
nil pointer のデバッグを実施する
hachi の開発中、さっそく build して実行してみたら、nil pointer でランタイムエラーになった。これを delve でデバッグしてみる。
VSCode の Go extension にて delve をインストールし、下記タブから debug を実行した(左上の再生マーク)結果、
1
2
| Failed to continue - bad access
Failed to next - bad access
|
というエラーが出てきた。本来は、どの変数が nil だったのか、どのステップが問題だったのかを知りたいところだが、On macOS a SIGSEGV (EXC_BAD_ACCESS) can not be propagated back to the target · Issue #852 · go-delve/delve という issue の通り、まだそのような実装ができていなそうだ。
(full feature とは…)
そこで、まず始めに go build して実行してみて、スタックトレースを確認する。
 1
 2
 3
 4
 5
 6
 7
 8
 9
10
11
12
13
14
15
16
17
18
19
20
21
22
23
24
25
26
27
28
29
30
31
32
33
34
| git clone git@github.com:go-zen-chu/hachi.git
# debug 用にあえて runtime error が発生するバージョンを残した
git checkout abdfd733da97d615726dddeeddca710278bec3d5
# build は通る
go build .
# runtime error が発生する
./hachi serve
serve called
panic: runtime error: invalid memory address or nil pointer dereference
[signal SIGSEGV: segmentation violation code=0x1 addr=0x50 pc=0x1440de5]
goroutine 1 [running]:
github.com/spf13/viper.pflagValue.HasChanged(0x0, 0xc000093680)
/Users/amasuda/go/pkg/mod/github.com/spf13/viper@v1.6.2/flags.go:41 +0x5
github.com/spf13/viper.(*Viper).find(0xc0000bab40, 0x154b74c, 0x4, 0x1, 0x10d3017, 0xc000095790)
/Users/amasuda/go/pkg/mod/github.com/spf13/viper@v1.6.2/viper.go:1075 +0x1681
github.com/spf13/viper.(*Viper).Get(0xc0000bab40, 0x154b74c, 0x4, 0x1, 0x1)
/Users/amasuda/go/pkg/mod/github.com/spf13/viper@v1.6.2/viper.go:728 +0x81
github.com/spf13/viper.Get(...)
/Users/amasuda/go/pkg/mod/github.com/spf13/viper@v1.6.2/viper.go:725
github.com/go-zen-chu/hachi/cmd.glob..func1(0x1929aa0, 0x194eb30, 0x0, 0x0)
/Users/amasuda/personal/hachi/cmd/serve.go:19 +0x9e
github.com/spf13/cobra.(*Command).execute(0x1929aa0, 0x194eb30, 0x0, 0x0, 0x1929aa0, 0x194eb30)
/Users/amasuda/go/pkg/mod/github.com/spf13/cobra@v0.0.5/command.go:830 +0x2aa
github.com/spf13/cobra.(*Command).ExecuteC(0x1929820, 0x103cd1a, 0x18e9580, 0xc000000180)
/Users/amasuda/go/pkg/mod/github.com/spf13/cobra@v0.0.5/command.go:914 +0x2fb
github.com/spf13/cobra.(*Command).Execute(...)
/Users/amasuda/go/pkg/mod/github.com/spf13/cobra@v0.0.5/command.go:864
github.com/go-zen-chu/hachi/cmd.Execute()
/Users/amasuda/personal/hachi/cmd/root.go:24 +0x31
main.main()
/Users/amasuda/personal/hachi/main.go:6 +0x20
|
スタックトレースから nil pointer で落ちていること、hachi プログラムの中では、root.go の 24 行目での処理が失敗していることがわかる。
さらに、プログラム内で利用している viper ライブラリの flags.go 41行目で nil pointer が起きているようだ。
該当コードをみると、
1
2
3
4
| // HasChanged returns whether the flag has changes or not.
func (p pflagValue) HasChanged() bool {
return p.flag.Changed <——
}
|
ここで発生しているようだ。nil pointer なので、 p か p.flag の中身が nil になっていることが想像つく。
このように、スタックトレースを見るだけでも何が問題になっていそうかわかるが、より複雑な条件で発生しているランタイムエラーは、この変数の中に何が入っているかを確認できると嬉しい。
そこで、delve の出番になる。
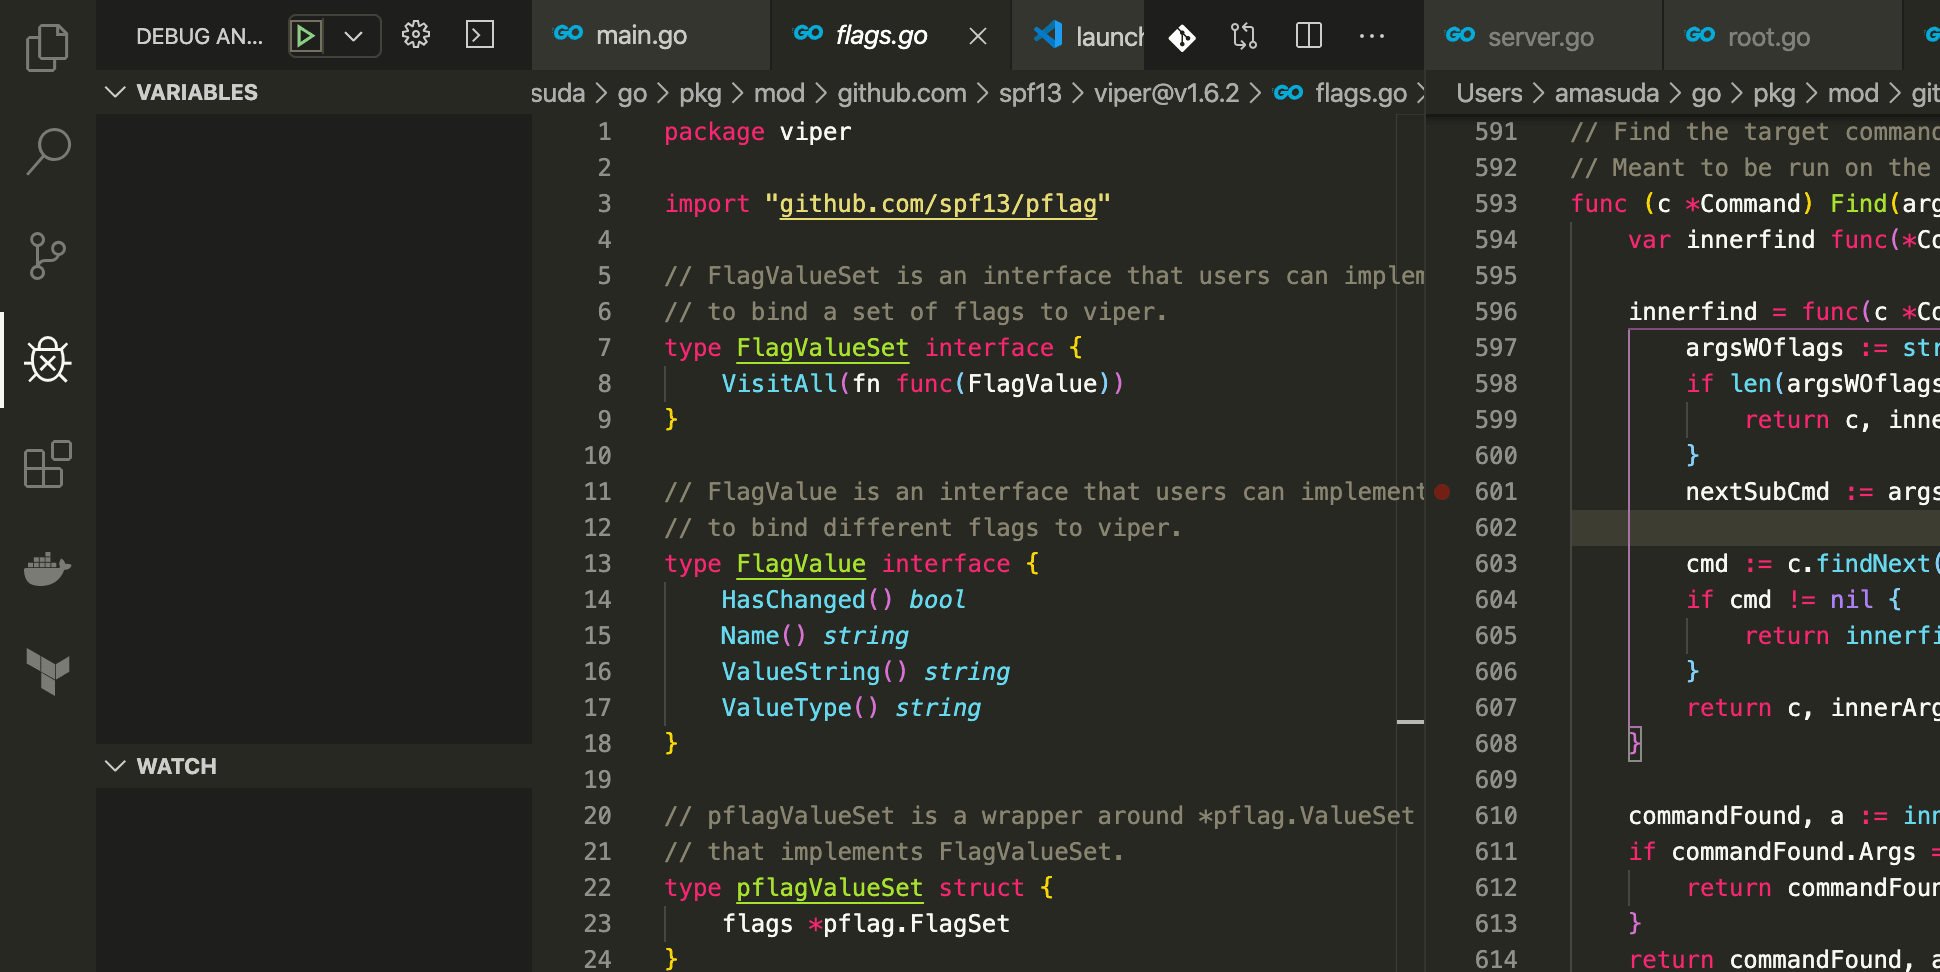
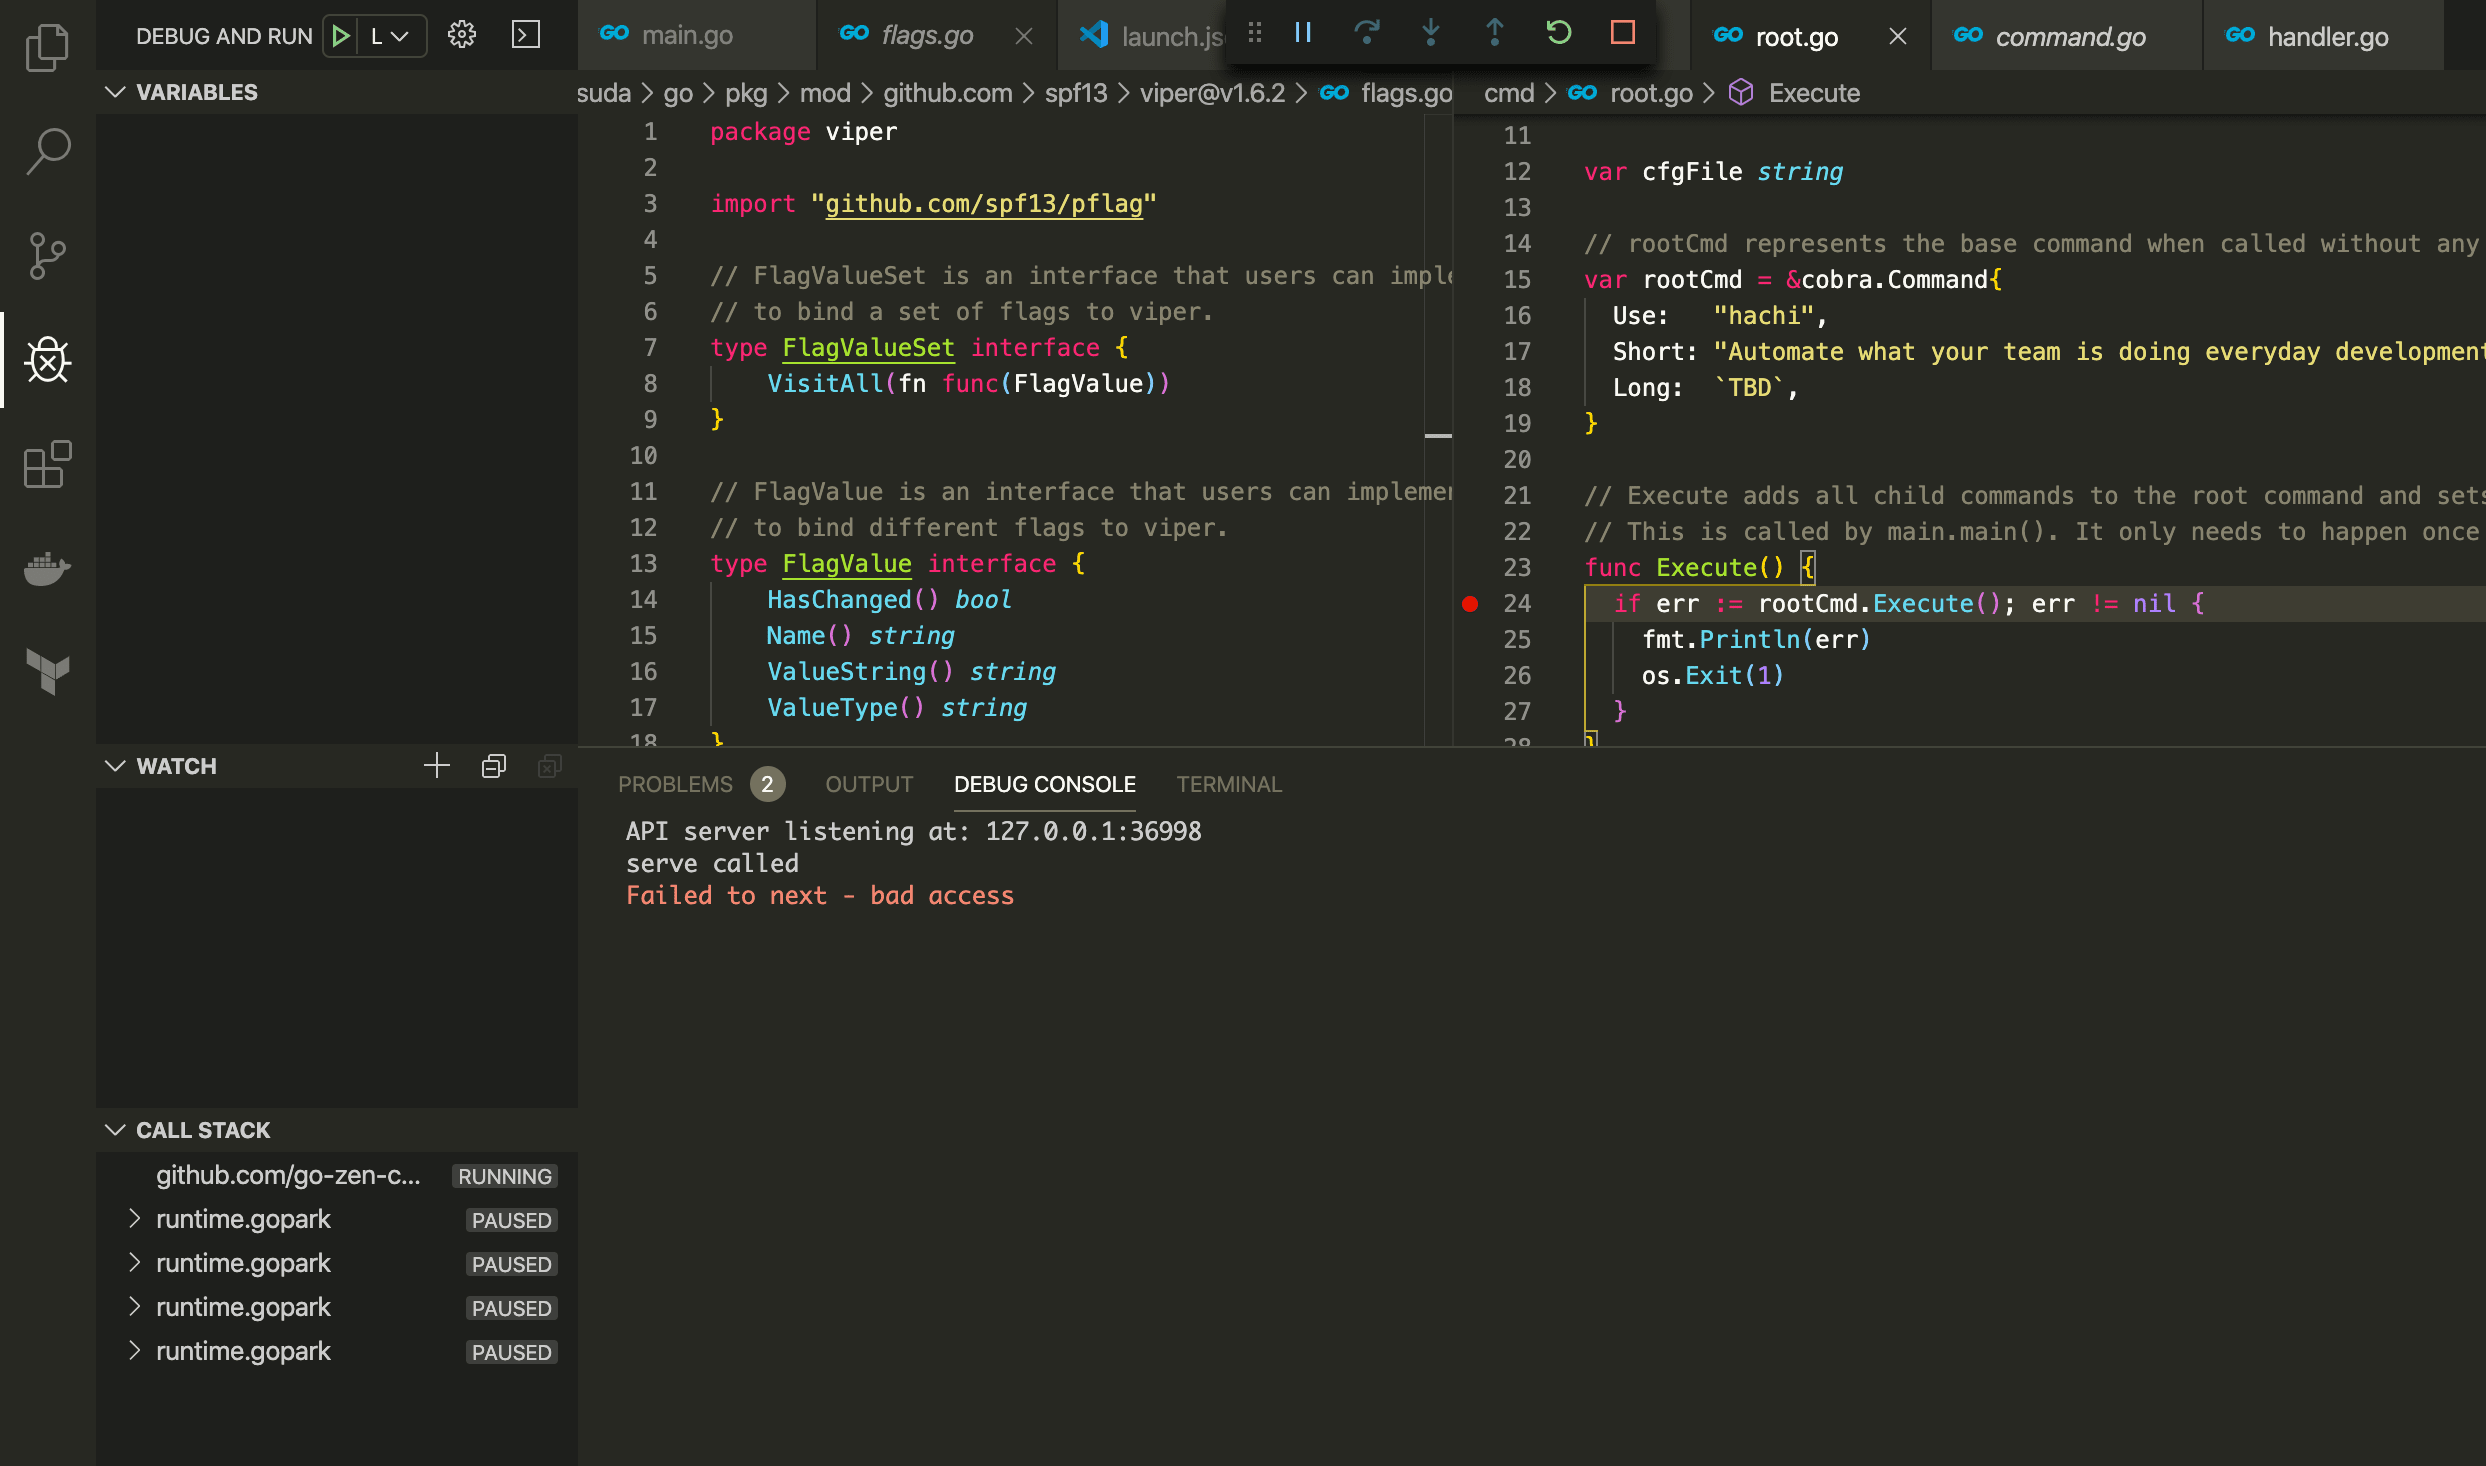
上記の通り、そのままデバッグを行ってしまうと、どこで落ちたのか、どのような変数が入っていたのか分からないまま異常終了してしまうため、root.go 24行と flags.go 41行目に break point を置いておく。
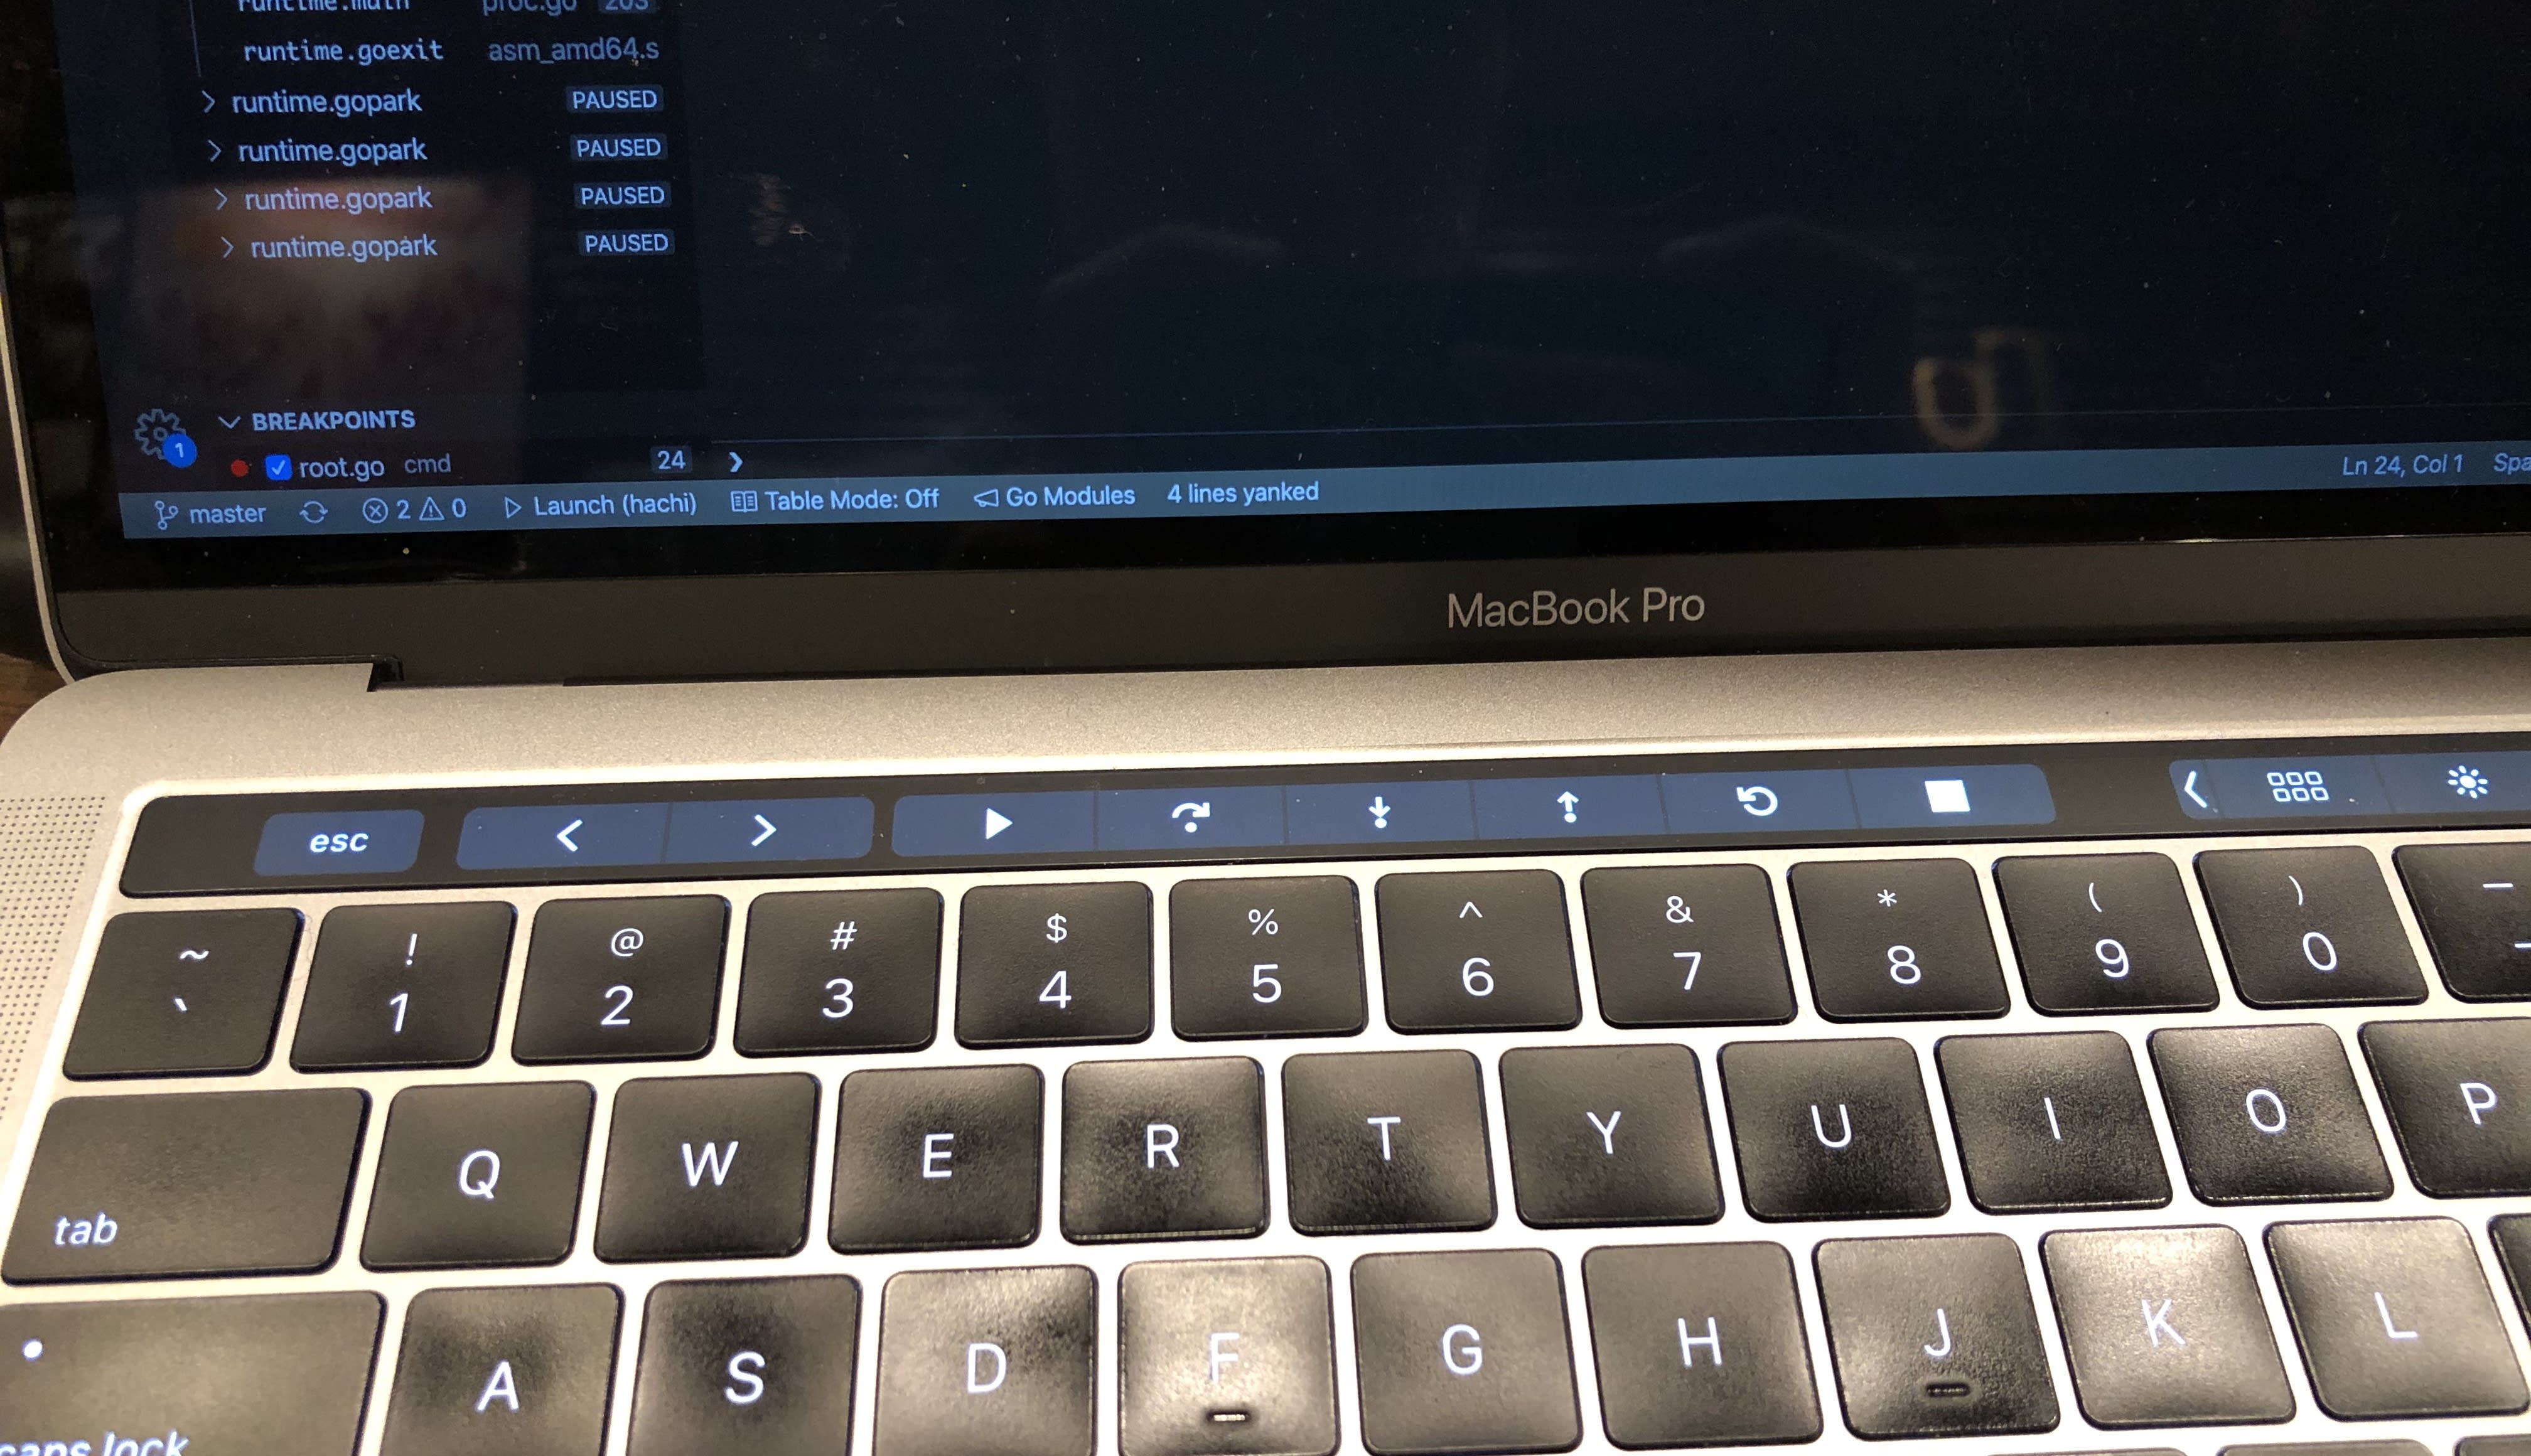
その後、continue (F5) で、スタックトレースをたどっていく。このとき、touch bar に出てくるのは地味に嬉しい(F5, F10 とか覚えるの辛いので)
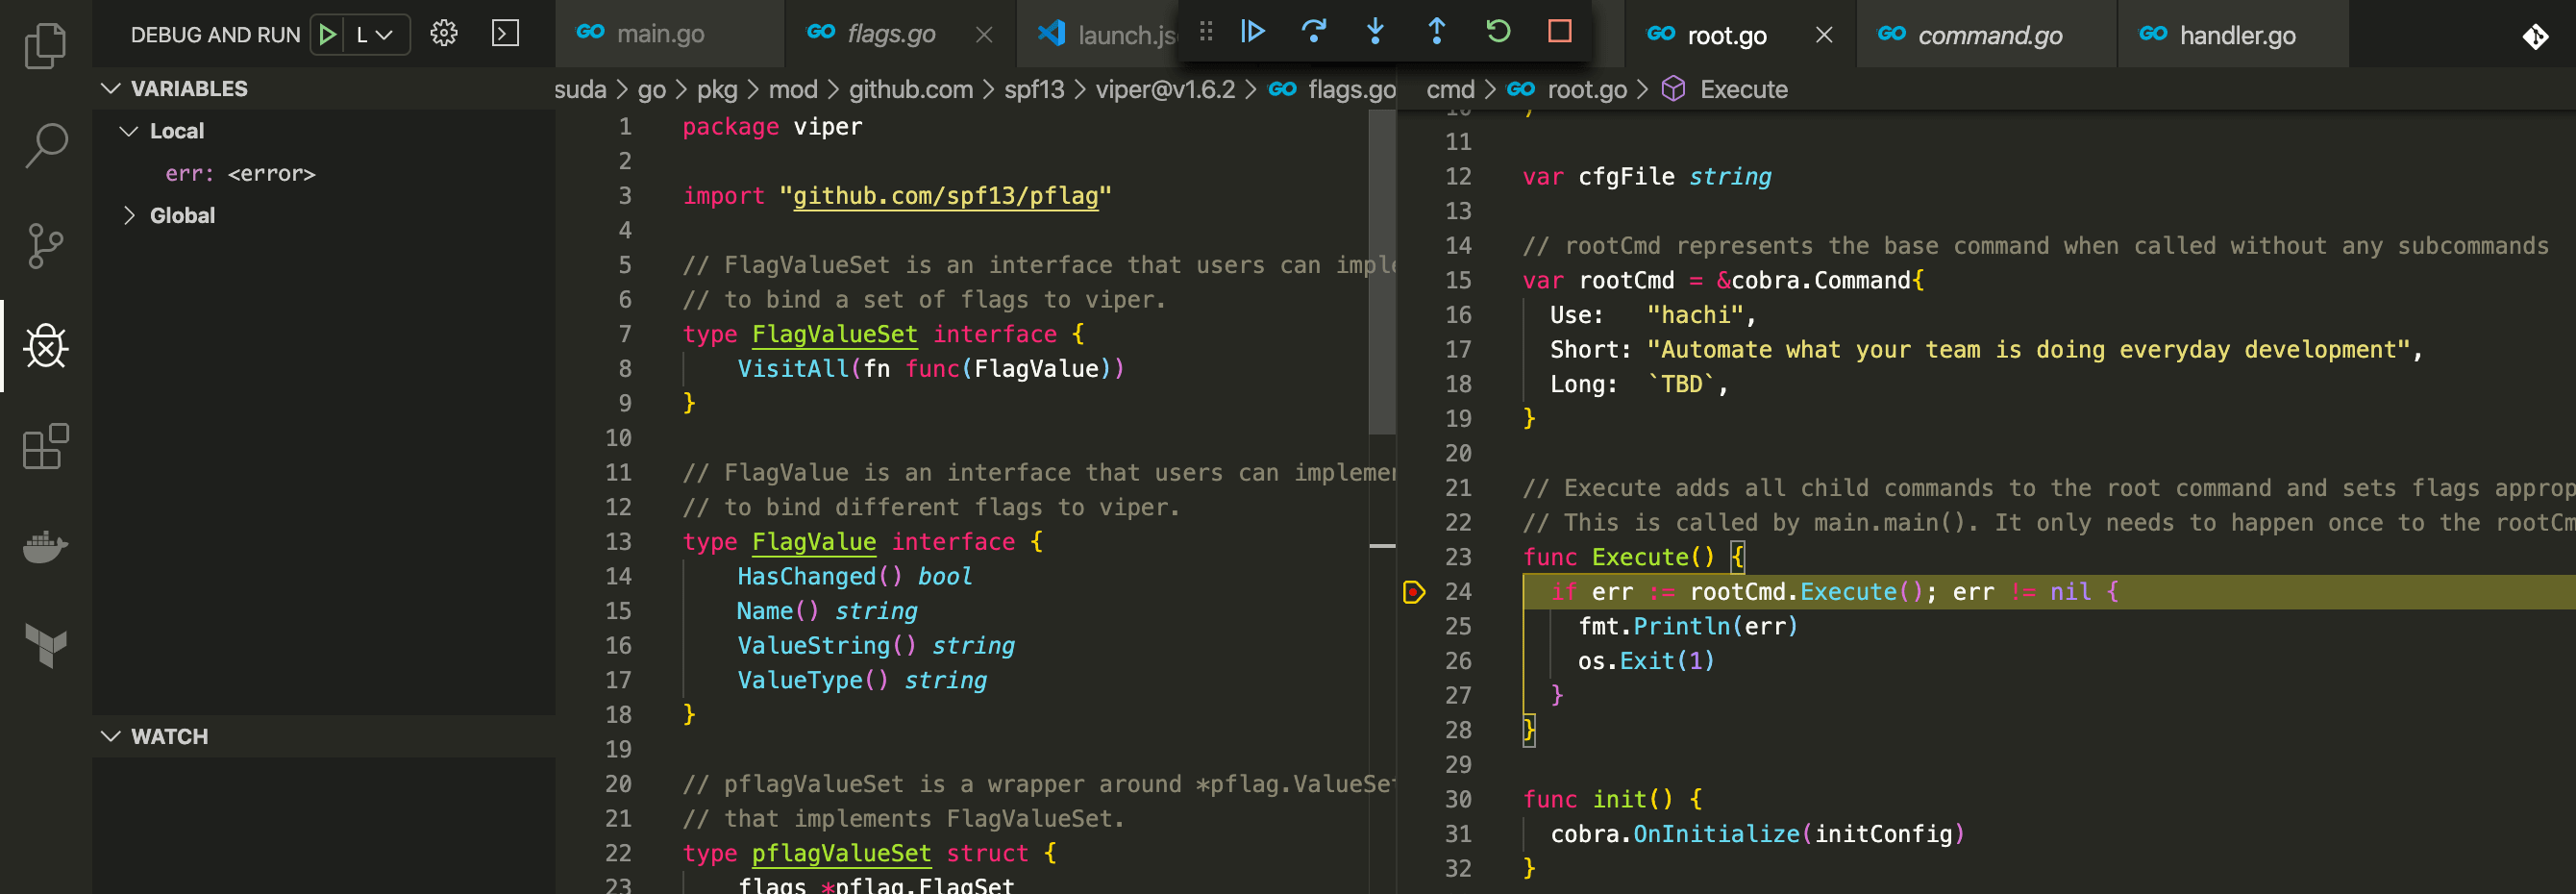
breakpoint の場所で止まると、 p.flag の中身が nil になっている(左上)。そのため、なぜ nil なのかを考えればよい。
これは、viper にてオプションをルックアップするときに、Flags の中身から取得しようとして nil になっていた。
(本来、error 返すとかしてくれたほうが嬉しいのだが…)
そのため、Flags ではなく、設定している PersistentFlags 関数に置き換えるとこの nil ポインタのエラーは解消された。
delve で使える便利機能
ブレークポイントに条件をもたせる
これは他のデバッガーでも利用できるが、例えば for 文の中で「この index のときだけ落ちる」というような場合、ブレークポイントに条件をもたせることで、エラーになる直前の状況を確認できる。
VSCode だと、ブレークポイントの場所にて右クリックで有効にできる。
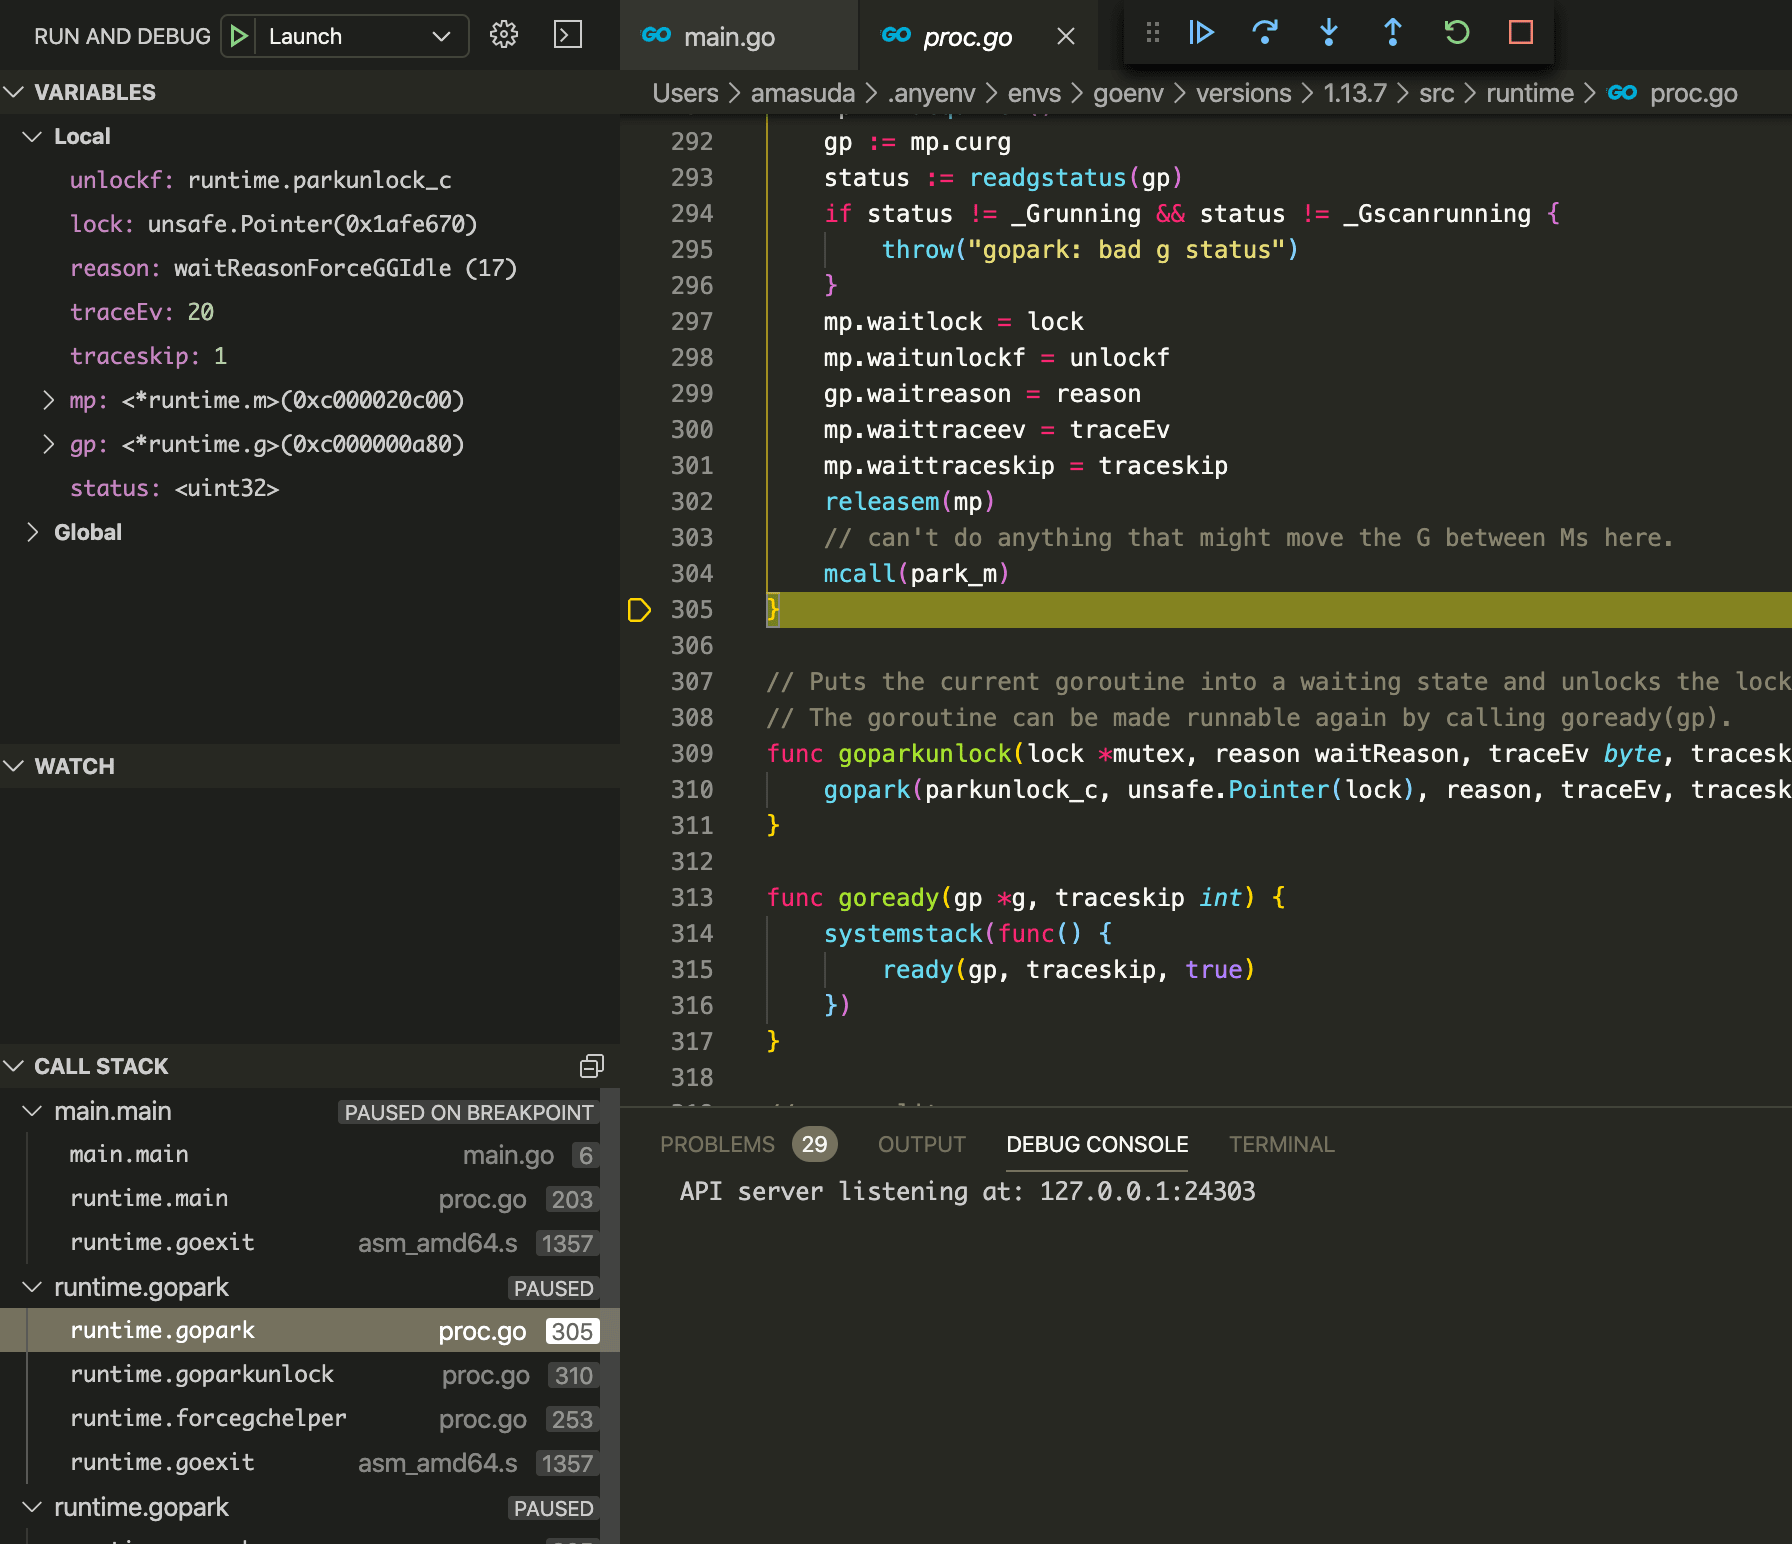
他の goroutine の状態を確認する
go で並列処理するときに欠かせない goroutine の状態を確認できる。
基本的に main.main goroutine を見ていることが多いが、Go runtime が Go GC の goroutine を走らせているのを確認できる。
をみると、runtime.forcegchelper や runtime.bgsweep が別の goroutine として動作していることがわかる。
runtime の goroutine は gopark が呼び出されており、xxx.gopark という名前になっている。これは goroutine が一時停止状態になっている。
実行中の go バイナリにアタッチする
1
| go build -gcflags "-N -l" .
|
と GC flag を指定して、build すると、関数のインライン化と最適化をなくすことができる。
こうすることで、ソースコードの行番号と実際に動作している機械語の 1:1 の対応を取ることができる(その代わりパフォーマンスを犠牲にする)
gcflags の詳細については下記のとおり go tool compile -h で取得できる。
 1
 2
 3
 4
 5
 6
 7
 8
 9
10
11
12
13
14
15
16
17
18
19
20
21
22
23
24
25
26
27
28
29
30
31
32
33
34
35
36
37
38
39
40
41
42
43
44
45
46
47
48
49
50
51
52
53
54
55
56
57
58
59
60
61
62
63
64
65
66
67
68
69
70
71
72
73
74
75
76
77
78
79
80
81
82
83
84
85
86
87
88
89
90
91
92
93
94
95
96
97
98
| $ go tool compile -h
usage: compile [options] file.go...
-% debug non-static initializers
-+ compiling runtime
-B disable bounds checking
-C disable printing of columns in error messages
-D path
set relative path for local imports
-E debug symbol export
-I directory
add directory to import search path
-K debug missing line numbers
-L show full file names in error messages
-N disable optimizations
-S print assembly listing
-V print version and exit
-W debug parse tree after type checking
-asmhdr file
write assembly header to file
-bench file
append benchmark times to file
-blockprofile file
write block profile to file
-buildid id
record id as the build id in the export metadata
-c int
concurrency during compilation, 1 means no concurrency (default 1)
-complete
compiling complete package (no C or assembly)
-cpuprofile file
write cpu profile to file
-d list
print debug information about items in list; try -d help
-dwarf
generate DWARF symbols (default true)
-dwarfbasentries
use base address selection entries in DWARF
-dwarflocationlists
add location lists to DWARF in optimized mode (default true)
-dynlink
support references to Go symbols defined in other shared libraries
-e no limit on number of errors reported
-gendwarfinl int
generate DWARF inline info records (default 2)
-goversion string
required version of the runtime
-h halt on error
-importcfg file
read import configuration from file
-importmap definition
add definition of the form source=actual to import map
-installsuffix suffix
set pkg directory suffix
-j debug runtime-initialized variables
-l disable inlining
-lang string
release to compile for
-linkobj file
write linker-specific object to file
-live
debug liveness analysis
-m print optimization decisions
-memprofile file
write memory profile to file
-memprofilerate rate
set runtime.MemProfileRate to rate
-mutexprofile file
write mutex profile to file
-newescape
enable new escape analysis (default true)
-nolocalimports
reject local (relative) imports
-o file
write output to file
-p path
set expected package import path
-pack
write to file.a instead of file.o
-r debug generated wrappers
-race
enable race detector
-s warn about composite literals that can be simplified
-shared
generate code that can be linked into a shared library
-smallframes
reduce the size limit for stack allocated objects
-std
compiling standard library
-symabis file
read symbol ABIs from file
-traceprofile file
write an execution trace to file
-trimpath prefix
remove prefix from recorded source file paths
-v increase debug verbosity
-w debug type checking
-wb
enable write barrier (default true)
|
1
2
| $ dlv attach <PID>
(dlv) break main.go:8
|
のようにして、実行中のバイナリに対して dlv を attach できる。
この間、バイナリは停止しているが、continue を実施すれば処理を再開するため、ブレークポイントを置いて、continue して様子を見るということが可能。
coredump を dlv で確認する
1
2
| gcore <PID>
dlv core <binary name> <coredump name>
|
これで coredump の中の変数の状態やスタックトレースを確認できる。
しかし、2020/02/15 現在のところ、Windows, Linux にのみ対応していそう。
 1
 2
 3
 4
 5
 6
 7
 8
 9
10
| $ dlv core --help
Examine a core dump.
The core command will open the specified core file and the associated executable and let you examine the state of the process when the core dump was taken.
Currently supports linux/amd64 core files and windows/amd64 minidumps.
Usage:
dlv core <executable> <core> [flags]
|
そこで、Mac からでも dlv core の検証が行えるように、Linux で gcore を利用できるサンプルを https://github.com/go-zen-chu/delve-debug-sample で作った。
 1
 2
 3
 4
 5
 6
 7
 8
 9
10
11
12
| # run with security option to use ptrace
docker run --rm --cap-add=SYS_PTRACE --security-opt seccomp=unconfined \
-it -v ${PWD}:/delve-debug-sample centos8-gdb /bin/bash
# in centos8 container
cd /delve-debug-sample
./delve-debug-sample &
gcore <PID>
exit
# on MacOS
dlv core delve-debug-sample core.<PID>
(dlv) goroutines
|
まあ、本番稼働する Go のバイナリを Mac で走らせることはそうないだろうし、Linux でのやり方がわかっていればよいのではないですかね(暴論)